Data Discovery Process- 5 Steps to Success
Data analytics is becoming increasingly valuable for business operations throughout all industries. In fact, 53% of companies adopted big data in 2017, which refers to the utilization and interpretation of large and complex data sets.
Effectively extracting and analyzing an organization's metrics enable management teams to gain insight into their potential and optimize their overall performance.
What is Data Discovery?

Data discovery is an iterative process of consolidating raw data from various sources in a way that allows business owners to comprehensively analyze information. The process is tailored to collect large volumes of information across multiple departments and identify trends and outliers in the company's performance.
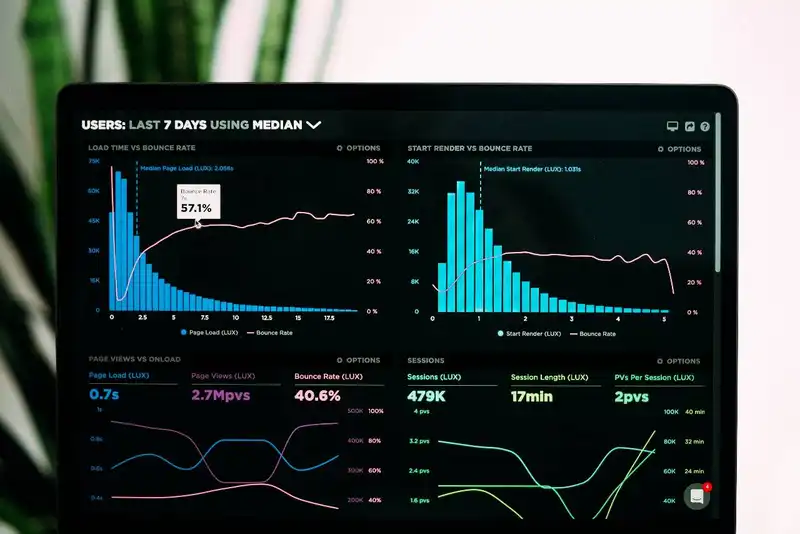
Smart data discovery tools enable organizations to have interactive and digestible information about their operation using visual navigation. Data visualizations generally come in the form of charts and graphs, making complex quantitative information easier to interpret.
The process also utilizes guided advanced analytics, which helps users conduct proper data analysis by presenting statistical information on the metrics gathered. With the help of data analytics software, business users can utilize features, such as algorithm-based suggestions to improve performance and predictive analysis.
By understanding and finding value from data, organizations will have the ability to make informed decisions that will help them meet their short and long term objectives, improve their strategies, and have a competitive advantage in their industry.
5 Steps of Data Discovery

With the guidance of the following 5 steps, the data discovery process can translate complicated and unstructured data into valuable and coherent information.
1. Connect and Blend Data
To begin the process of data discovery, all necessary measurements and metrics must be collected, such as the supply chain data and financial services information. Effective analysis can only be conducted once all scattered data from various sources are placed together in a data warehouse.
For example, an analyst for a retail store may want to observe if weather patterns affect sales on select clothing items at the shop. To do this, the initial step is to compile the weather and product sales data during a chosen time period. Doing so will enable business owners to evaluate and connect the information as one metric.
Case studies show organizations can streamline this process by using integration software because it empowers users to compile complex real-time datasets from disparate systems and connect them to allow a free flow of data. This type of technology has standardized data formats that can integrate any data sources necessary, without the need to develop custom integrations, allocate extra spending on maintenance, or receive complicated machine learning.
2. Clean and Prepare Data
Raw data can be difficult to interpret; therefore, the data discovery process requires all collected metrics to be cleaned and standardized. Data cleansing consists of detecting any errors, distortion, or corruption of data, and then correcting or removing the flawed information from the database. At this point, management should also ensure all datasets are using the correct unit of measurement to prevent skewed results.
This process of data preparation also includes manually re-processing data due to duplicates or incomplete parts. Cleaning data will effectively make a dataset reliable and accurate, allowing for robust analysis.

3. Share Data
Data should be shared with authorized personnel in the organization. Sharing data at this step will allow the information to be used to its fullest potential, as different individuals can evaluate the data in their own way and provide unique perspectives. This helps organizations gather diverse interpretations of various aspects of the data.
4. Analyze and Develop Insights
Once management teams and data scientists have access to the distributed version of data, they can evaluate, analyze, and identify value from the information. Businesses that are at this stage of data discovery often use analytical tools to generate insights.
One such tool is distributional analysis, which is a process that identifies and correlates recurring trends or patterns with meaning. For instance, restaurant owners may use distributional analysis to pinpoint their rush hours so they can find ways to schedule more employees for those times.
Organizations can also use predictive analytics, which uses data and statistical algorithms to assess future outcomes. Additionally, market basket analysis allows users to see purchasing patterns, such as combinations of items that customers often buy together.
5. Visualize Insights
Once all business teams have developed insights from the data, they must share their ideas to the organization. The best way to do this is to use visual analytics, such as scatter plots, charts, and maps.
Using visual data as a discovery tool will make metrics and its interpretations easier and quicker to understand since it typically only highlights main ideas and focuses on specific goals.
Benefits of Data Discovery

Data discovery unlocks maximum optimization for businesses, enabling management teams to-
- Develop Actionable Plans
- Save Time
- Gather Unique Insights
- Recycle Data
Effectively executing the data discovery process will leverage a business's understanding of its operations, as well as maximize their business analytics and goal achievement with data-driven decision-making.


